

21 Aug
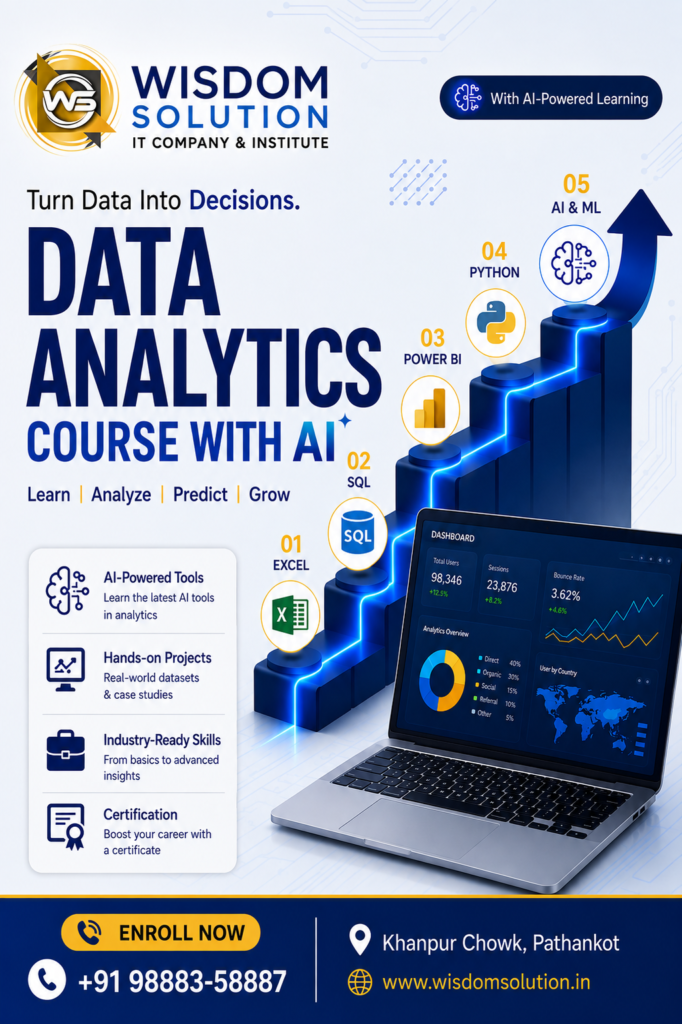
PLearn Data Analytics with Excel, SQL and Power BI
Data is an essential part of modern business decision-making. Companies use spreadsheets, databases, and business intelligence tools to understand sales, customers, finance, marketing, and daily operations. Power BI with Excel & SQL provides a practical learning path for students and professionals who want to develop strong data analytics skills.
Excel helps organize and analyze data, SQL allows users to work with databases, and Power BI transforms information into interactive dashboards and reports.
Why Learn Excel, SQL and Power BI?
Learning these three technologies together gives students a complete understanding of the data analytics process. Excel is useful for data preparation and calculations, SQL is valuable for retrieving information from databases, and Power BI helps present the results through professional visualizations.
With this combination, learners can develop skills in:
- Data cleaning and preparation
- Excel formulas and PivotTables
- SQL queries and database management
- Data transformation
- Data modeling
- Interactive dashboards
- Business reporting
- Data visualization
Excel Skills for Data Analysis
Microsoft Excel is one of the most widely used tools for working with business data. Students can learn formulas, functions, sorting, filtering, charts, PivotTables, and data-cleaning techniques.
Important Excel topics can include:
- IF and nested IF functions
- XLOOKUP and VLOOKUP
- SUMIFS and COUNTIFS
- Text and date functions
- PivotTables
- Charts and graphs
- Data validation
- Conditional formatting
These skills help learners prepare structured datasets before moving them into business intelligence tools.
SQL for Database Management
SQL is used to retrieve, filter, organize, and analyze information stored in relational databases. Understanding SQL helps learners work with larger datasets that may not be convenient to manage entirely in spreadsheets.
Students can practice:
- SELECT statements
- WHERE conditions
- ORDER BY
- GROUP BY
- Aggregate functions
- INNER JOIN and LEFT JOIN
- Subqueries
- Data filtering
- Database fundamentals
SQL knowledge is particularly useful for data analysts and business intelligence professionals who work with company databases.
Business Intelligence and Power BI Dashboards
Microsoft Power BI helps transform raw data into meaningful visual reports. Learners can connect information from Excel files, SQL databases, and other sources and then create interactive dashboards.
The training can cover:
- Power Query
- Data cleaning
- Data modeling
- Table relationships
- DAX fundamentals
- Charts and visualizations
- Slicers and filters
- Interactive reports
- Dashboard design
- Report sharing and publishing
Using Power BI for business intelligence allows users to identify trends, compare performance, and communicate important insights more effectively.
Practical Data Analytics Projects
Practical projects help students understand how different tools work together. A sales analytics project, for example, can begin with an Excel dataset, use SQL to retrieve additional information, and then use Power BI to create an interactive dashboard.
Other project ideas include:
- Sales performance dashboard
- Employee analytics dashboard
- Inventory management report
- Customer analysis dashboard
- Financial reporting dashboard
- Marketing performance report
These projects provide practical experience and help learners build a portfolio for future career opportunities.
Power BI with Excel & SQL Training at Wisdom Solution
Wisdom Solution offers technology-focused training designed to help students develop practical and career-oriented skills. The course can introduce learners to Excel data analysis, SQL database queries, data visualization, and dashboard development.
Students can work with real-world datasets and practical assignments to understand how data is collected, prepared, analyzed, and presented.
You can also explore the Data Analytics Course to learn about additional analytics topics and practical training options.
For students interested in web technologies, explore the Web Designing Course and develop additional digital skills.
Learners who want to expand their programming knowledge can also visit the Programming Courses section.
Career Opportunities in Data Analytics
After developing practical skills in spreadsheet analysis, SQL, and business intelligence, learners can explore several career paths, including:
- Data Analyst
- Business Intelligence Analyst
- Reporting Analyst
- MIS Executive
- Business Analyst
- Junior Data Analyst
- Power BI Developer
These skills can also benefit professionals working in sales, finance, marketing, operations, administration, and management.
Start Your Data Analytics Journey
Learning Excel, SQL, and Power BI can provide a strong foundation for modern data analysis and reporting. By combining spreadsheet skills, database knowledge, and interactive visualization, learners can understand data from collection to final business insights.
Start your journey with Power BI with Excel & SQL training at Wisdom Solution and gain practical experience through exercises, dashboards, and real-world projects.